> ## Documentation Index
> Fetch the complete documentation index at: https://docs.tryordinal.com/llms.txt
> Use this file to discover all available pages before exploring further.
# Analytics
> Track post performance, engagement, and earned media value for LinkedIn, Twitter/X, Instagram, and Facebook posts.
Understand what's working and what isn't. Ordinal's analytics help you track post performance, identify top content, and see which formats resonate with your audience - all in one place.
 ## Analytics Overview
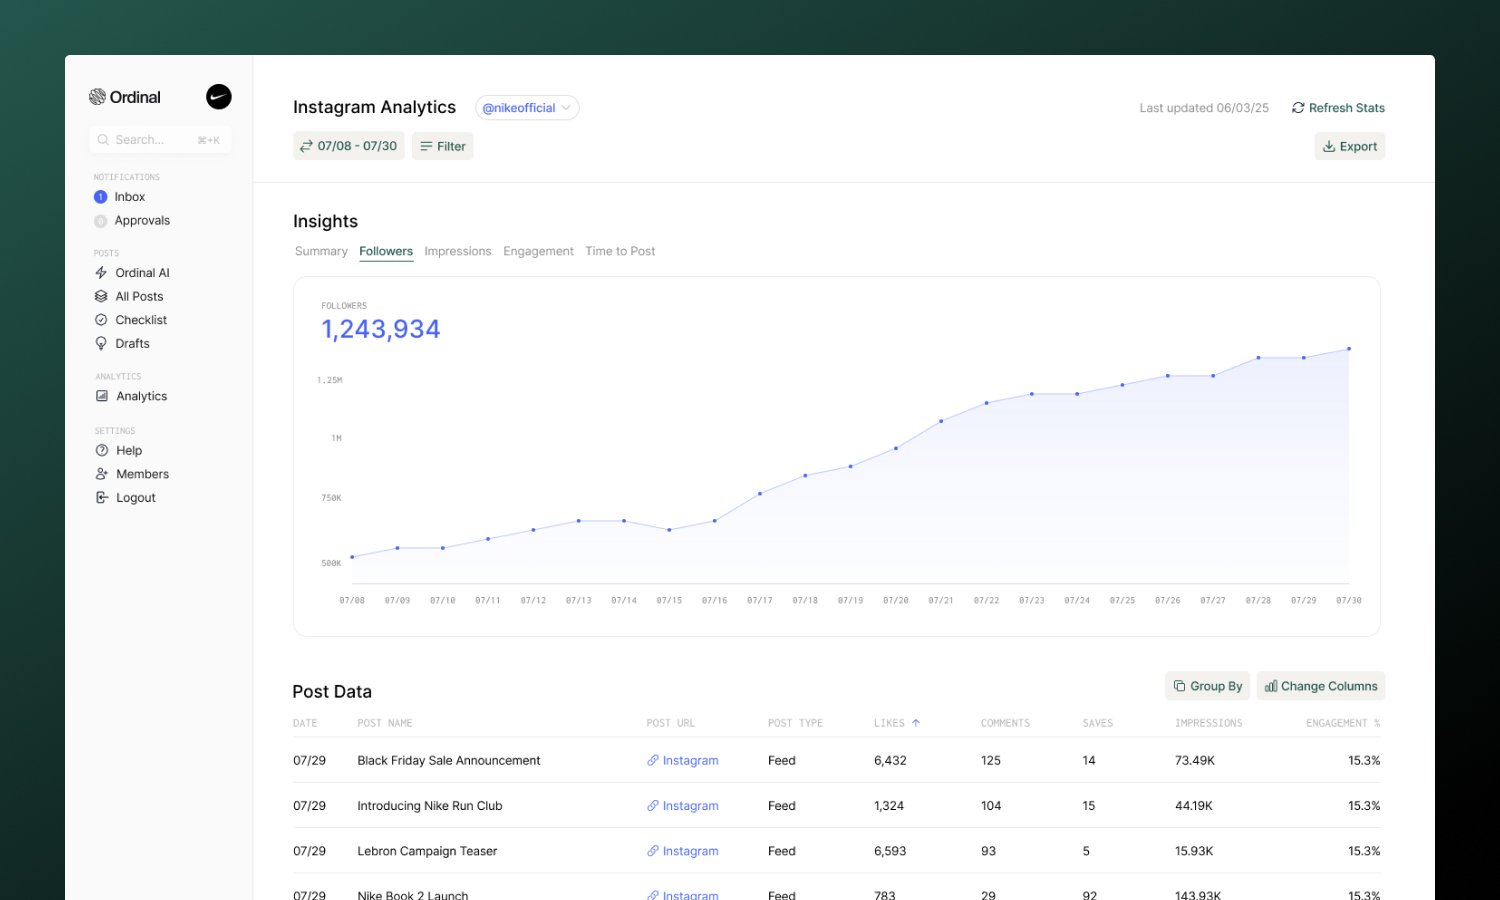
When you open **Analytics** from the sidebar, you land on the Analytics Overview page - a rollup view of performance across all your connected accounts. This is where you can see aggregate metrics like total impressions, engagement, and reach for each platform across your entire workspace.
For example, if you have three LinkedIn accounts connected, you'll see combined totals (total impressions across all LinkedIn accounts) plus a summary card for each individual account.
Click on any account card or **See More** to dive into that account's detailed analytics.
You can also switch to **Clicks Overview** to track click performance for links shortened with Ordinal's link shortener. See [Shortlinks](/analytics/shortlinks) for the full guide.
## Account-Level Analytics
Click into any account from the Overview to see detailed analytics for that specific profile. Each account page includes:
* **Summary stats** - Aggregate metrics for the selected date range with comparison to the previous period
* **Charts and graphs** - Visual trends showing performance over time
* **Post table** - Every post with its performance metrics, sortable by any column
* **Filters** - Narrow down by date range, post type, labels, or campaign
* **Export** - Download your data as a CSV for external analysis or client reporting
* **Earned Media Value** - See the dollar value of your organic reach based on configurable CPM
* **Refresh Stats** - Manually refresh analytics data on-demand (once per hour)
## Refreshing Stats
Analytics data syncs automatically each day, but you can manually refresh stats at any time using the **Refresh Stats** button on any account analytics page. This is useful when you want to see the latest performance data for recent posts.
* Click **Refresh Stats** in the top-right corner of any analytics page
* Stats can be refreshed **once per hour** per account
* The button shows when you last refreshed and how long until you can refresh again
Manual refresh is great for checking performance right after a post goes live or before a client meeting. For day-to-day tracking, the automatic daily sync is usually sufficient.
## Earned Media Value (EMV)
Earned Media Value helps you understand the monetary value of your organic social reach. EMV calculates what you would have paid in advertising to achieve the same number of impressions.
## Analytics Overview
When you open **Analytics** from the sidebar, you land on the Analytics Overview page - a rollup view of performance across all your connected accounts. This is where you can see aggregate metrics like total impressions, engagement, and reach for each platform across your entire workspace.
For example, if you have three LinkedIn accounts connected, you'll see combined totals (total impressions across all LinkedIn accounts) plus a summary card for each individual account.
Click on any account card or **See More** to dive into that account's detailed analytics.
You can also switch to **Clicks Overview** to track click performance for links shortened with Ordinal's link shortener. See [Shortlinks](/analytics/shortlinks) for the full guide.
## Account-Level Analytics
Click into any account from the Overview to see detailed analytics for that specific profile. Each account page includes:
* **Summary stats** - Aggregate metrics for the selected date range with comparison to the previous period
* **Charts and graphs** - Visual trends showing performance over time
* **Post table** - Every post with its performance metrics, sortable by any column
* **Filters** - Narrow down by date range, post type, labels, or campaign
* **Export** - Download your data as a CSV for external analysis or client reporting
* **Earned Media Value** - See the dollar value of your organic reach based on configurable CPM
* **Refresh Stats** - Manually refresh analytics data on-demand (once per hour)
## Refreshing Stats
Analytics data syncs automatically each day, but you can manually refresh stats at any time using the **Refresh Stats** button on any account analytics page. This is useful when you want to see the latest performance data for recent posts.
* Click **Refresh Stats** in the top-right corner of any analytics page
* Stats can be refreshed **once per hour** per account
* The button shows when you last refreshed and how long until you can refresh again
Manual refresh is great for checking performance right after a post goes live or before a client meeting. For day-to-day tracking, the automatic daily sync is usually sufficient.
## Earned Media Value (EMV)
Earned Media Value helps you understand the monetary value of your organic social reach. EMV calculates what you would have paid in advertising to achieve the same number of impressions.
 ### How it works
EMV is calculated using this formula:
```text theme={null}
EMV = (Impressions / 1,000) × CPM
```
Where **CPM** (Cost Per Mille) is the amount you'd pay for 1,000 ad impressions on that platform.
### Configuring CPM
Each channel has its own CPM setting that you can customize based on your industry benchmarks or actual ad costs:
1. Go to any account's analytics page
2. Click the **Earned Media Value** tab
3. Adjust the **CPM** input to match your target rate
CPM values are saved per channel on the workspace-level. That means if you change the CPM for one LinkedIn account, it'll change the calculation for all other LinkedIn accounts in the workspace.
Default values:
| Platform | Default CPM |
| --------- | ----------- |
| LinkedIn | \$30 |
| Twitter | \$10 |
| Instagram | \$10 |
| Facebook | \$10 |
Use your actual advertising CPM rates for the most accurate EMV calculations. If you're not running ads, industry benchmarks are a good starting point - LinkedIn typically has higher CPMs than other platforms due to its B2B audience.
### Viewing EMV
EMV appears in two places:
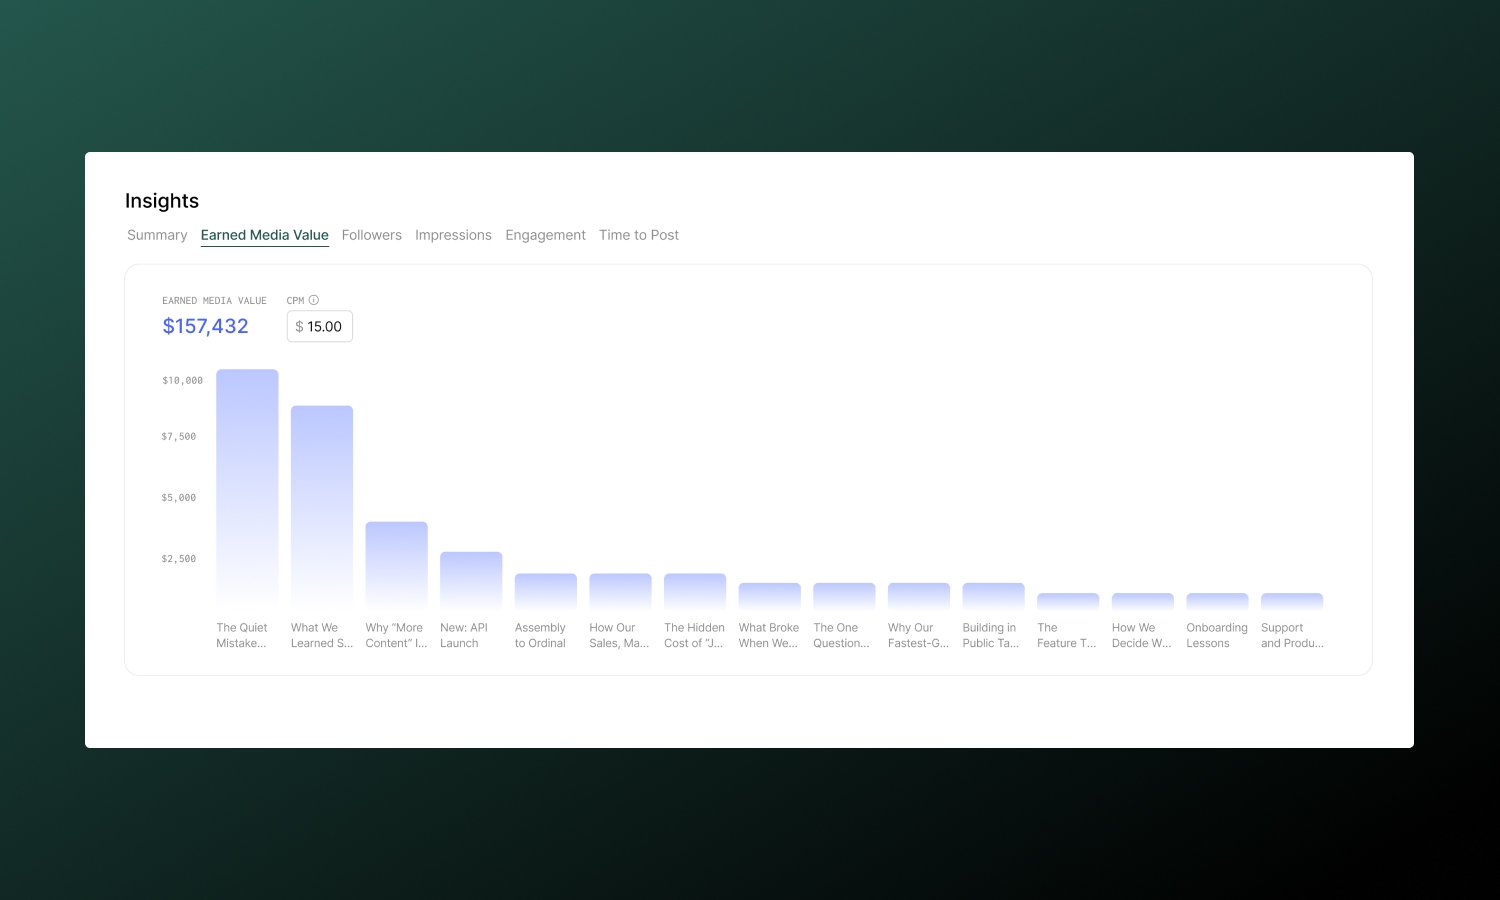
* **EMV tab** - A bar chart showing EMV by post, with total EMV for the selected date range
* **EMV column** - In the post table, showing individual post EMV values (sortable)
EMV is also included when you export analytics to CSV.
## Filtering
Filters help you slice your analytics to answer specific questions. All account analytics pages support:
| Filter | What it does |
| -------------- | ---------------------------------------------------------------------------------------------- |
| **Date range** | Focus on a specific time period (presets like "Last 7 days", "Last 30 days", or custom ranges) |
| **Post type** | Filter by content format - Text, Image, Video, Carousel, Reel, etc. |
| **Labels** | See how your custom labels perform (e.g., "Product updates" vs. "Industry news") |
| **Campaign** | View only posts from a specific campaign |
**Pro tip:** Use **Labels** to tag content by topic, theme, or goal. Then filter analytics by label to see which content buckets perform best - this is one of the most powerful ways to refine your content strategy over time.
## Exporting Data
Every account analytics page includes an **Export** button that downloads your current view as a CSV file. The export respects your active filters and date range, so you can create focused reports for clients or stakeholders.
## Plan Limitations
| Plan | Analytics history |
| ----------------- | ----------------- |
| **Starter** | Last 14 days |
| **Pro and above** | All time |
If you're on a Starter plan and need historical data, upgrade to Pro for unlimited analytics history.
***
## LinkedIn
LinkedIn is one of the most comprehensive analytics integrations in Ordinal, with support for both **personal profiles** and **company pages**. Analytics refresh automatically each day.
Personal profile analytics are available in Ordinal - a feature not all social media tools support.
### Metrics
| Metric | What it measures |
| ------------------- | ----------------------------------------------------------------------------------------- |
| **Impressions** | How many times your post was displayed in feeds |
| **Likes** | Total reactions (includes all reaction types) |
| **Comments** | Number of comments on your post |
| **Shares** | Times your post was shared or reposted |
| **Clicks** | Link clicks (for posts containing links) |
| **Saves** | Times your post was saved to view later (personal profiles only) |
| **Sends** | Times your post was sent via DM (personal profiles only) |
| **Engagement Rate** | (Likes + Comments + Shares + Clicks) / Impressions |
| **Video Views** | Total views on a video post |
| **Video Viewers** | Unique viewers of a video post |
| **Watch Time** | Total time spent watching a video post, formatted as a duration (e.g. `9m 16s`, `1h 30m`) |
Video metrics only populate for posts with type **Video**. Non-video posts show `-` in these columns. Personal profile video stats require the `r_member_postAnalytics` LinkedIn OAuth scope, which is granted when you connect a personal LinkedIn profile.
The **Video Views**, **Video Viewers**, and **Watch Time** columns are sortable and can be toggled from the column visibility menu. When you export to CSV, watch time is exported as raw seconds under `video_watch_time_seconds` (alongside `video_views` and `video_viewers`) so you can run your own calculations without parsing formatted strings.
### Post Types
Filter by content format to see what's working:
* **Text** - Text-only posts
* **Image** - Single image posts
* **Multi-Image** - Carousel-style image posts
* **Video** - Video posts
* **Document** - PDF carousel posts
* **Link** - Posts with link previews
***
## Twitter / X
Full analytics for all your tweets, including individual tweets within threads.
### Metrics
| Metric | What it measures |
| ------------------- | ------------------------------------------------------- |
| **Impressions** | How many times your tweet was seen in feeds |
| **Likes** | Total likes on your tweet |
| **Comments** | Replies to your tweet |
| **Retweets** | Times your tweet was retweeted |
| **Quote Tweets** | Times your tweet was quote-tweeted |
| **Bookmarks** | Times your tweet was saved to bookmarks |
| **Engagement Rate** | (Likes + Comments + Retweets + Bookmarks) / Impressions |
### Post Types
Filter by content format to understand what resonates:
* **Text** - Text-only tweets
* **Image** - Single image tweets
* **Multi-Image** - Tweets with multiple images
* **Video** - Video tweets
* **GIF** - Tweets with GIFs
***
## Instagram
Analytics for Feed posts, Reels, and Carousels published through Ordinal.
### Metrics
| Metric | What it measures |
| ------------------- | ---------------------------------------------------------- |
| **Impressions** | How many times your post was displayed |
| **Likes** | Total likes on your post |
| **Comments** | Number of comments |
| **Shares** | Times your post was shared via DM or to Stories |
| **Saves** | Times your post was saved to a collection (strong signal!) |
| **Engagement Rate** | (Likes + Comments + Shares + Saves) / Impressions |
### Post Types
Filter to compare how different formats perform:
* **Image** - Single image feed posts
* **Carousel** - Multi-image carousel posts
* **Reel** - Video Reels
***
## Facebook
Analytics for Facebook Page posts and Reels.
### Metrics
| Metric | What it measures |
| ------------------- | --------------------------------------------- |
| **Impressions** | How many times your post was displayed |
| **Reactions** | Total reactions (likes, loves, etc.) |
| **Comments** | Number of comments |
| **Shares** | Times your post was shared |
| **Engagement Rate** | (Reactions + Comments + Shares) / Impressions |
### Post Types
Filter by content format:
* **Photo** - Single image posts
* **Video** - Video posts
* **Reel** - Facebook Reels
* **Link** - Posts with link previews
***
## Coming Soon
Analytics for **TikTok, Threads** and **YouTube Shorts** are coming soon. If you'd like early access or have specific requests, reach out to us via chat or at [support@tryordinal.com](mailto:support@tryordinal.com).
Webflow, Slack, and Discord do not have analytics (these are CMS and messaging platforms without engagement metrics).
## Learn more
Track click performance on shortened links.
Group posts and analyze campaign performance.
### How it works
EMV is calculated using this formula:
```text theme={null}
EMV = (Impressions / 1,000) × CPM
```
Where **CPM** (Cost Per Mille) is the amount you'd pay for 1,000 ad impressions on that platform.
### Configuring CPM
Each channel has its own CPM setting that you can customize based on your industry benchmarks or actual ad costs:
1. Go to any account's analytics page
2. Click the **Earned Media Value** tab
3. Adjust the **CPM** input to match your target rate
CPM values are saved per channel on the workspace-level. That means if you change the CPM for one LinkedIn account, it'll change the calculation for all other LinkedIn accounts in the workspace.
Default values:
| Platform | Default CPM |
| --------- | ----------- |
| LinkedIn | \$30 |
| Twitter | \$10 |
| Instagram | \$10 |
| Facebook | \$10 |
Use your actual advertising CPM rates for the most accurate EMV calculations. If you're not running ads, industry benchmarks are a good starting point - LinkedIn typically has higher CPMs than other platforms due to its B2B audience.
### Viewing EMV
EMV appears in two places:
* **EMV tab** - A bar chart showing EMV by post, with total EMV for the selected date range
* **EMV column** - In the post table, showing individual post EMV values (sortable)
EMV is also included when you export analytics to CSV.
## Filtering
Filters help you slice your analytics to answer specific questions. All account analytics pages support:
| Filter | What it does |
| -------------- | ---------------------------------------------------------------------------------------------- |
| **Date range** | Focus on a specific time period (presets like "Last 7 days", "Last 30 days", or custom ranges) |
| **Post type** | Filter by content format - Text, Image, Video, Carousel, Reel, etc. |
| **Labels** | See how your custom labels perform (e.g., "Product updates" vs. "Industry news") |
| **Campaign** | View only posts from a specific campaign |
**Pro tip:** Use **Labels** to tag content by topic, theme, or goal. Then filter analytics by label to see which content buckets perform best - this is one of the most powerful ways to refine your content strategy over time.
## Exporting Data
Every account analytics page includes an **Export** button that downloads your current view as a CSV file. The export respects your active filters and date range, so you can create focused reports for clients or stakeholders.
## Plan Limitations
| Plan | Analytics history |
| ----------------- | ----------------- |
| **Starter** | Last 14 days |
| **Pro and above** | All time |
If you're on a Starter plan and need historical data, upgrade to Pro for unlimited analytics history.
***
## LinkedIn
LinkedIn is one of the most comprehensive analytics integrations in Ordinal, with support for both **personal profiles** and **company pages**. Analytics refresh automatically each day.
Personal profile analytics are available in Ordinal - a feature not all social media tools support.
### Metrics
| Metric | What it measures |
| ------------------- | ----------------------------------------------------------------------------------------- |
| **Impressions** | How many times your post was displayed in feeds |
| **Likes** | Total reactions (includes all reaction types) |
| **Comments** | Number of comments on your post |
| **Shares** | Times your post was shared or reposted |
| **Clicks** | Link clicks (for posts containing links) |
| **Saves** | Times your post was saved to view later (personal profiles only) |
| **Sends** | Times your post was sent via DM (personal profiles only) |
| **Engagement Rate** | (Likes + Comments + Shares + Clicks) / Impressions |
| **Video Views** | Total views on a video post |
| **Video Viewers** | Unique viewers of a video post |
| **Watch Time** | Total time spent watching a video post, formatted as a duration (e.g. `9m 16s`, `1h 30m`) |
Video metrics only populate for posts with type **Video**. Non-video posts show `-` in these columns. Personal profile video stats require the `r_member_postAnalytics` LinkedIn OAuth scope, which is granted when you connect a personal LinkedIn profile.
The **Video Views**, **Video Viewers**, and **Watch Time** columns are sortable and can be toggled from the column visibility menu. When you export to CSV, watch time is exported as raw seconds under `video_watch_time_seconds` (alongside `video_views` and `video_viewers`) so you can run your own calculations without parsing formatted strings.
### Post Types
Filter by content format to see what's working:
* **Text** - Text-only posts
* **Image** - Single image posts
* **Multi-Image** - Carousel-style image posts
* **Video** - Video posts
* **Document** - PDF carousel posts
* **Link** - Posts with link previews
***
## Twitter / X
Full analytics for all your tweets, including individual tweets within threads.
### Metrics
| Metric | What it measures |
| ------------------- | ------------------------------------------------------- |
| **Impressions** | How many times your tweet was seen in feeds |
| **Likes** | Total likes on your tweet |
| **Comments** | Replies to your tweet |
| **Retweets** | Times your tweet was retweeted |
| **Quote Tweets** | Times your tweet was quote-tweeted |
| **Bookmarks** | Times your tweet was saved to bookmarks |
| **Engagement Rate** | (Likes + Comments + Retweets + Bookmarks) / Impressions |
### Post Types
Filter by content format to understand what resonates:
* **Text** - Text-only tweets
* **Image** - Single image tweets
* **Multi-Image** - Tweets with multiple images
* **Video** - Video tweets
* **GIF** - Tweets with GIFs
***
## Instagram
Analytics for Feed posts, Reels, and Carousels published through Ordinal.
### Metrics
| Metric | What it measures |
| ------------------- | ---------------------------------------------------------- |
| **Impressions** | How many times your post was displayed |
| **Likes** | Total likes on your post |
| **Comments** | Number of comments |
| **Shares** | Times your post was shared via DM or to Stories |
| **Saves** | Times your post was saved to a collection (strong signal!) |
| **Engagement Rate** | (Likes + Comments + Shares + Saves) / Impressions |
### Post Types
Filter to compare how different formats perform:
* **Image** - Single image feed posts
* **Carousel** - Multi-image carousel posts
* **Reel** - Video Reels
***
## Facebook
Analytics for Facebook Page posts and Reels.
### Metrics
| Metric | What it measures |
| ------------------- | --------------------------------------------- |
| **Impressions** | How many times your post was displayed |
| **Reactions** | Total reactions (likes, loves, etc.) |
| **Comments** | Number of comments |
| **Shares** | Times your post was shared |
| **Engagement Rate** | (Reactions + Comments + Shares) / Impressions |
### Post Types
Filter by content format:
* **Photo** - Single image posts
* **Video** - Video posts
* **Reel** - Facebook Reels
* **Link** - Posts with link previews
***
## Coming Soon
Analytics for **TikTok, Threads** and **YouTube Shorts** are coming soon. If you'd like early access or have specific requests, reach out to us via chat or at [support@tryordinal.com](mailto:support@tryordinal.com).
Webflow, Slack, and Discord do not have analytics (these are CMS and messaging platforms without engagement metrics).
## Learn more
Track click performance on shortened links.
Group posts and analyze campaign performance.